
Key Take Aways
- Covers the Latest History Dashboard for displaying data points over time, customizable by group or position average, and the Visualization Builder for tracking KPIs within a Dashboard Layout.
- Also links a guide for building custom Dashboard Layouts per training group and an overview of all Dashboard Builder features for real-time performance monitoring.
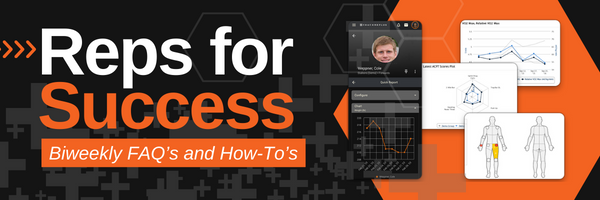
DISCOVER THE DASHBOARD BUILDER

Latest History Dashboard: A Detailed Overview
An individual dashboard that allows you to display data points over times, customizable to include groups or position average.

Tracking KPIs With Visualization Builder: A Detailed Overview
Keep on top of your data by incorporating a Latest History Dashboard into your Dashboard Layout to easily track your KPIs.

How to: Build a Dashboard Layout
Discover how to set different Dashboard Layouts for each of your training groups to keep it customized to highlight what each athlete prioritizes most.

Dashboard Builders
Explore the different Dashboard Builder features and customizations that help empower coaches with real-time performance monitoring and analysis.
Recent Comments